


Effective reporting and analytics provide the ability for Timekeepers to efficiently consume data in an efficient manner to drive productivity, efficiency, all while developing a sense of competitive advantage. Done properly, analytics can prove to be a great strategy in changing the way employees perform their jobs. Such data can increase productivity and employee satisfaction, as well as provide insights into individual performance and goal achievements for the business as a whole. TimeSolv has a great feature allowing Timekeepers to view Time & Expense analytics. This week’s Tip of the Week takes a look at how to dive into the analytics dashboard feature.
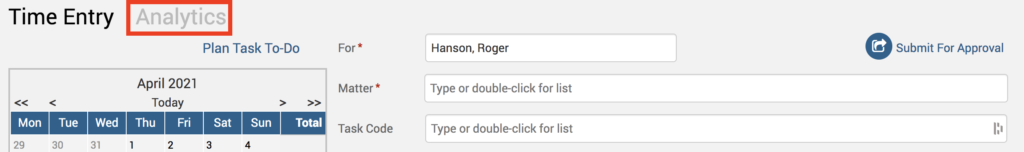
Under both the main Time and Expense Entry screens you’ll see a new ‘Analytics‘ button above the calendar.
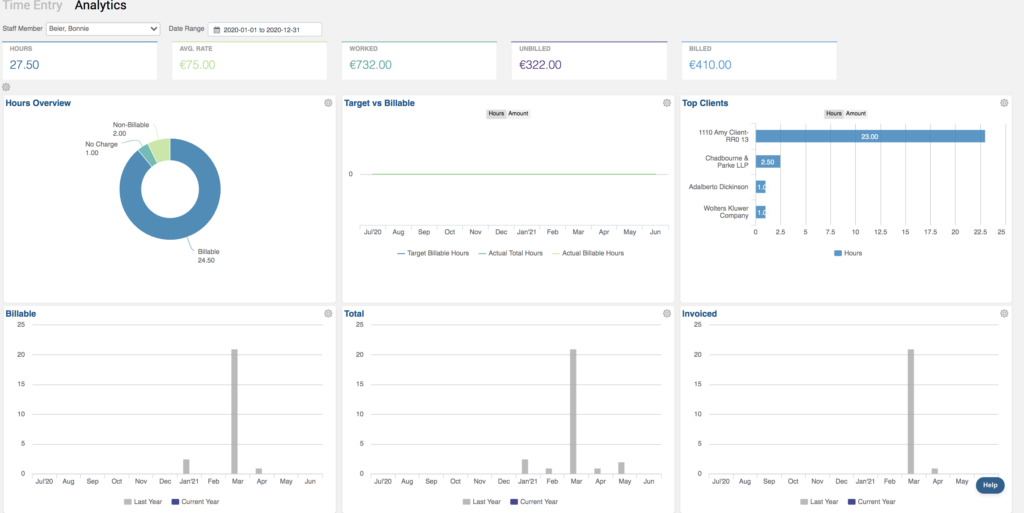
Timekeepers can view summarized charts showing the following performances:
- Target vs Actual Billable hours
- Comparison of current and past year performance
- Breakdown of hours based on the billable type
- Top 5 Clients by Time/Expense amount
- The amount by Expense Code
Users can view the above charts for other Timekeepers too, as long as they have the correct permissions set up.
This new feature is a great way for Timekeepers to view a summary view of Time and Expense-related performance metrics.
If you’d like to contact TimeSolv support for help, please call 1.800.715.1284 or Contact support!