Tip of the Week: See Your Law Firm in a New Light with Dashboards


Staff Dashboard
The Staff Dashboard is your window into your team’s performance. Monitor metrics, set targets, and drive data-driven decisions:
- Firm Staff Metrics: Key insights on billable hours, expenses, and more. Tooltips provide deeper understanding.
- Graphical Charts: Visualize data based on your preferences.
- Target vs. Actual: Compare actual performance against targets for informed decisions.
- Billable Hours: Breakdown and projections for your selected period.
- Top Timekeeper: Identify your best performers and understand performance distribution.
- Worked Time: Analyze worked hours for different categories.
- Utilization Rate: Track staff efficiency for billable work.
- Realization Rate: Insights into billable hours realization.
- Collection Rate: Assess financial performance by tracking collected hours.
- Staff Data Overview: Quick glance at essential attributes for each timekeeper.
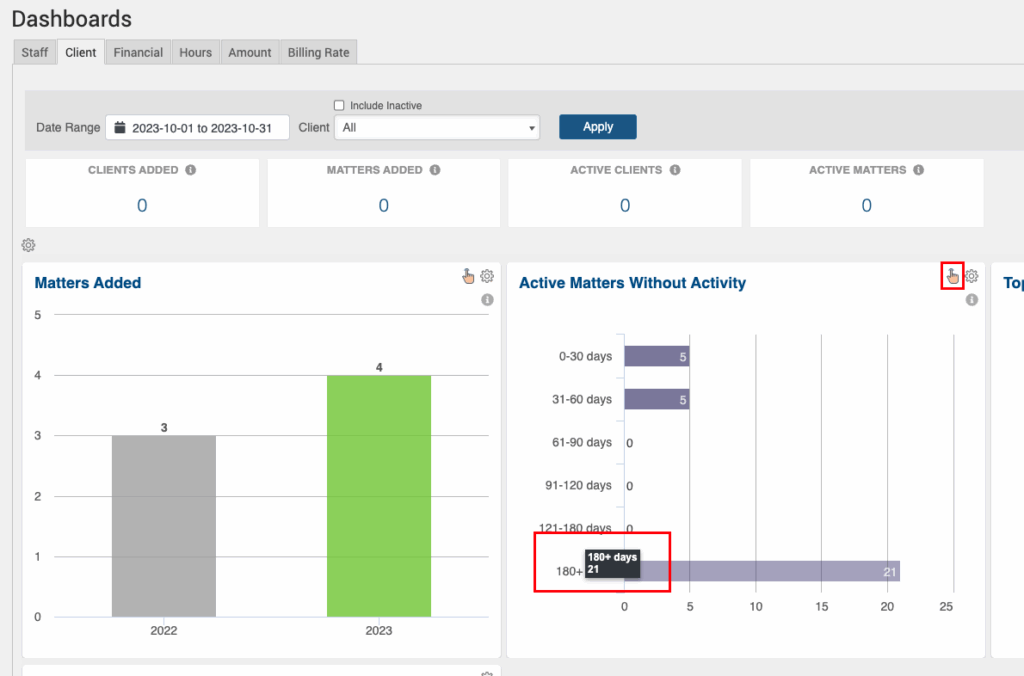
Client Dashboard
The Client Dashboard provides a comprehensive view of client-related metrics to optimize your client relationships:
- Client Metrics: Insights into client and matter counts.
- Graphical Charts: Visual representation customized to your preferences.
- Active Matters without Activity: Monitor client engagement.
- Matters Added: Track matters added year-over-year.
- Top Clients: Analyze your top clients for different attributes.
- Top Originating Timekeepers: Discover key sources of revenue.
- Client-Matter Data Overview: Summarized view of client and matter data.
Financial Dashboard
Optimize your financial strategy with the Financial Dashboard, offering aggregated financial performance insights:
- Filters: Focus your analysis with specific time periods, clients, and matters.
- Financial Metrics: Key financial metrics at a glance.
- Graphical Charts: Customize your dashboard with charts of your choice.
- Top Timekeeper: Identify your top contributors to revenue.
- Top Client: Optimize client relationships based on financial performance.
- Top Debtors: Keep an eye on outstanding balances and aged accounts.
- Collection: Monitor monthly collection performance.
- Collection By Payment Method: Understand payment preferences.
- Collection Performance: Compare worked and collected amounts.
- Aged Invoices: Keep your financial health in check.
- Hourly Rate: Optimize billing strategy with insights into hourly rates.
- Billing Performance: Track monthly billing performance.
- Financial Data Overview: Quick view of client and matter attributes.
Interactive Options on Many Tiles:
Additionally, we’ve recently introduced an interactive option on many of the tiles. You’ll notice a small hand symbol in the upper right corner, which means you can hover over the data in that tile to provide you with more in-depth information. This feature enhances your ability to delve deeper into your data and gain a better understanding of your financial and goal-tracking performance.
In conclusion Dashboards are your powerhouse tools for optimizing your law firm’s operations. They unlock insights into staff performance, client relationships, and financial health. By harnessing the power of these Dashboards, you’ll pave the way for your firm’s success.
With TimeSolv, you can navigate your financial journey and achieve your goals with confidence. Stay on track, stay informed, and stay successful.
wherever you do.
TimeSolv in action.