Tip of the Week: Using the Dashboard


Goals provide you with a direction and a destination, while systematically focussing your attention on the achievable. Setting personal goals and experiencing those achievements can be very motivating, and these accomplishments ultimately fuel your desire to continue to aim higher and meet those targets.
The TimeSolv Dashboard is an incredible tool to help you increase your revenue through valuable insight. You get a graphical representation of hours, amount and billing rate for the whole year. Both admin and non-admin users can view the Dashboard, but admin users have more rights than non-admin users. Firm admins can also view the Dashboard of any non-admin user in that firm. Firm managers can also quickly compare billed hours to the amount of revenue that’s been collected and track their firms profitability.
To grant Dashboard access, head over under the Account tab and click on Settings. Scroll to towards the bottom of the page and check the box for ‘Enable Dashboard?‘, and click save.
The Dashboard benefits your business by allowing you to review these individual billing statistics and increase your revenue by providing valuable information on your staff’s performance. Since this feature directly addresses each Timekeeper you have, you can watch out for personal progress and accountability. Timekeepers can also track their own hours, amounts, and rates via the Dashboard screen.
There will be three tabs available to you under the Dashboard screen: Hours, Amount, and Billing Rate (the ‘Amount’ and ‘Billing Rate’ tabs will not display if ‘Can view and override Rate?’ is disabled from timekeeper’s permission tab. Only Firm admin can change these permissions under Account>Staff/Timekeeper/Professionals>Name>Permissions). You can set target hours and rates for each Timekeeper and for the required year.
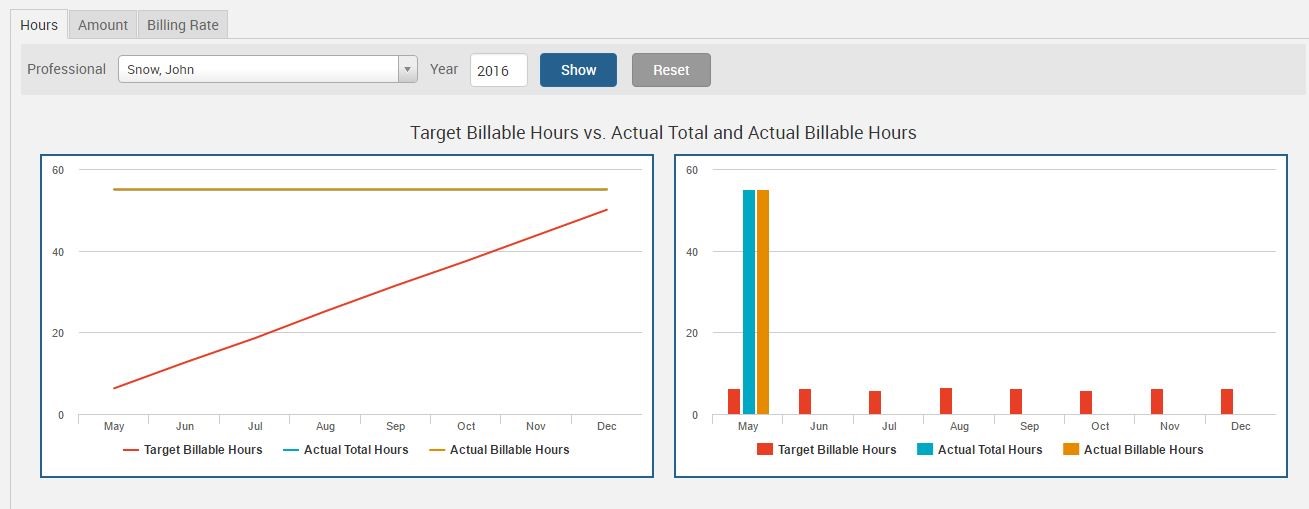
- Hours – a bar chart will be displayed, showing target, actual billable and actual total hours grouped by month in the specified year. Another line chart is also displayed. It shows the same data as cumulative
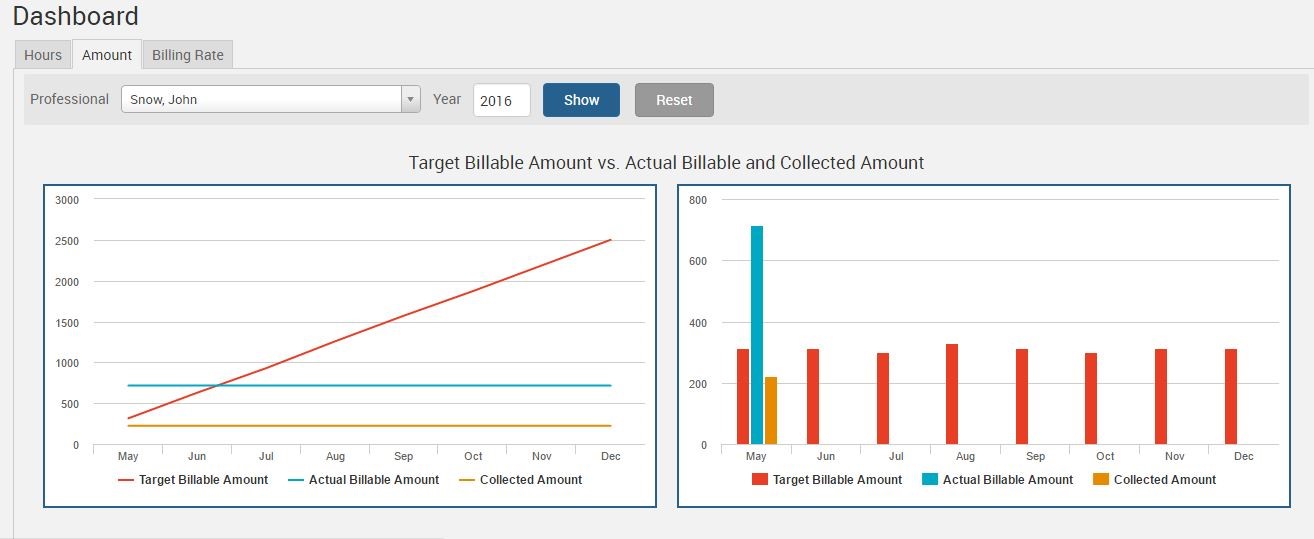
- Amount – a bar chart will be displayed, showing targets, actual billable and actual collected amounts grouped by month in the selected year. Another line chart is also displayed. It shows the same data as cumulative.
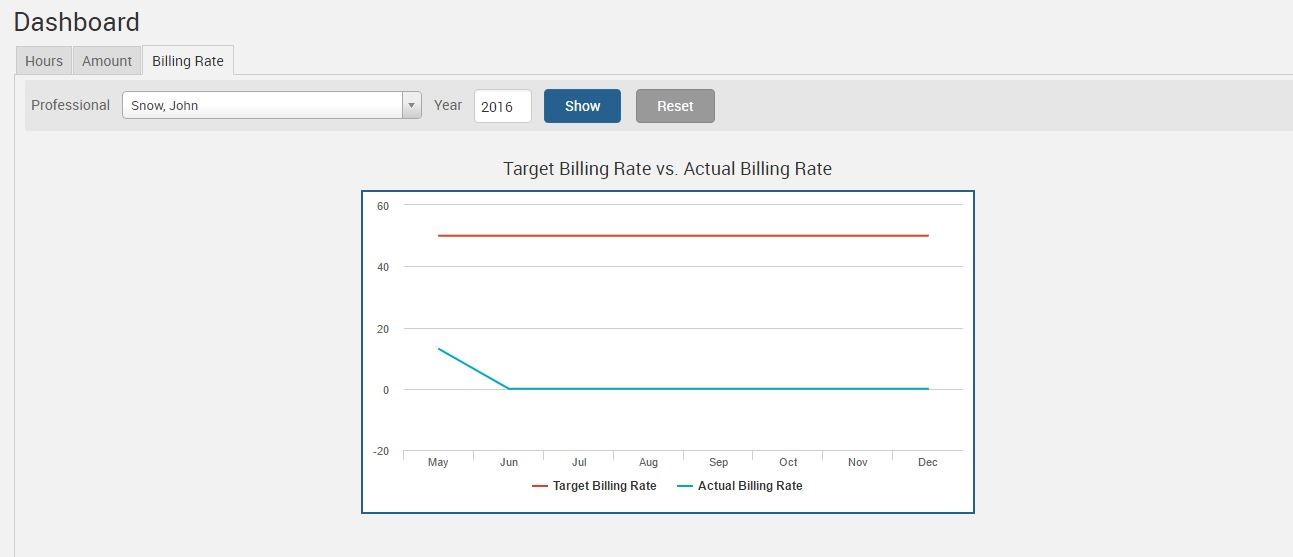
- Billing Rate – a line chart will be displayed, showing target and actual average rate grouped by month in the selected year.
If you’d like more help with understanding the features on our Dashboard screen, please call us at 1.800.715.1284, email us at support@timesolv.com or Contact support.
wherever you do.
TimeSolv in action.